
Four colorful triangle icons representing time management, communication, productivity, and workflow.

The Agility Blue Platform

Agility Blue’s Workflow, Dashboards, Communications, and Reporting features combine to create a powerful, comprehensive platform for managing all of your team’s workload. Easily create, track, collaborate and report on everything your team is working on.

Agility Blue artfully moves project management and communication into a central environment allowing for enhanced collaboration. We can easily leverage the project data to provide relevant, timely activity and status reports to stakeholders.
— E. Sue Marshall, Senior Project Advisor

Workflows

Flowchart diagram with four connected nodes, illustrating a process or steps in a sequence, with a yellow and white color scheme on a black background.

Create projects and tasks on the fly, and apply custom forms and templates to streamline workflows.
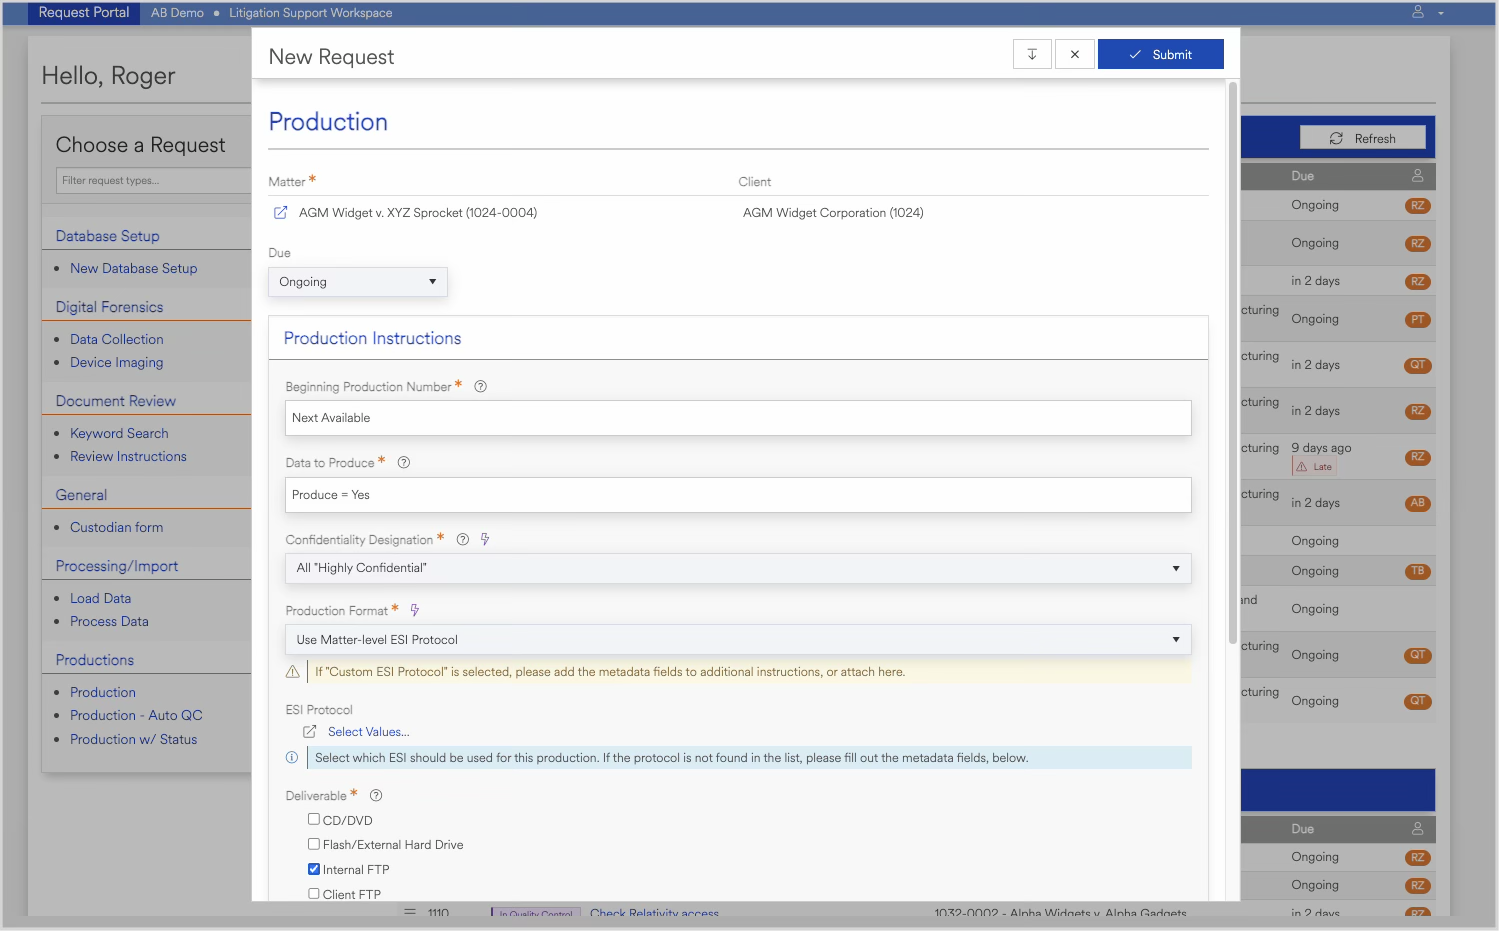
Screenshot of a software interface for submitting production requests, featuring fields for production instructions, confidentiality, format, and delivery options.
A black and green triangular sign with a white circle in the center featuring a clock showing 12:00, indicating urgency or a countdown.

Dashboards

Search, filter, and work on your projects directly from one of four dynamic dashboards.
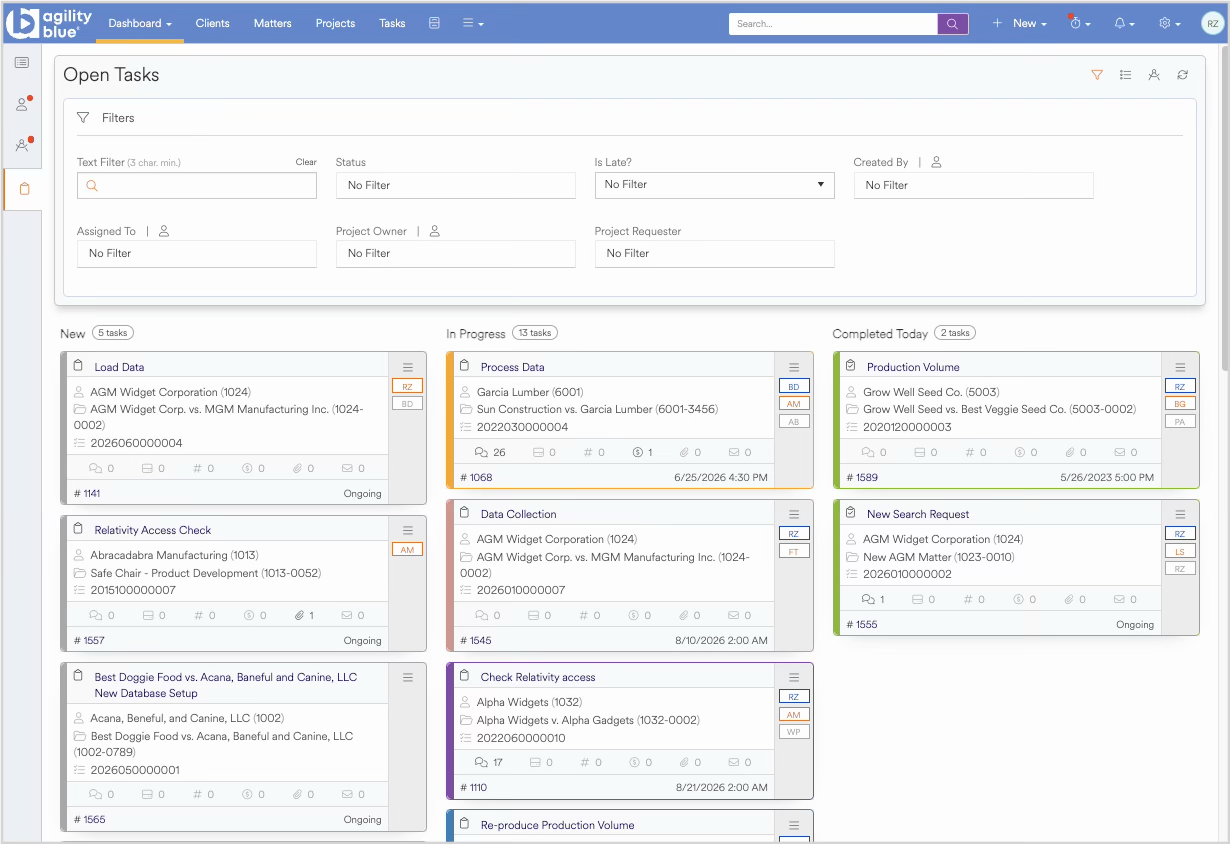
A project management dashboard showing open tasks categorized into sections: New, In Progress, and Completed Today. Tasks include titles, project owners, deadlines, and labels, with some tasks assigned to team members.
An icon of a speech bubble inside a circle, with a small tail pointing down, overlapping a blue triangle pointing right, on a black background.

Communications

Your central hub for communications, keeping team members updated on progress in real time.
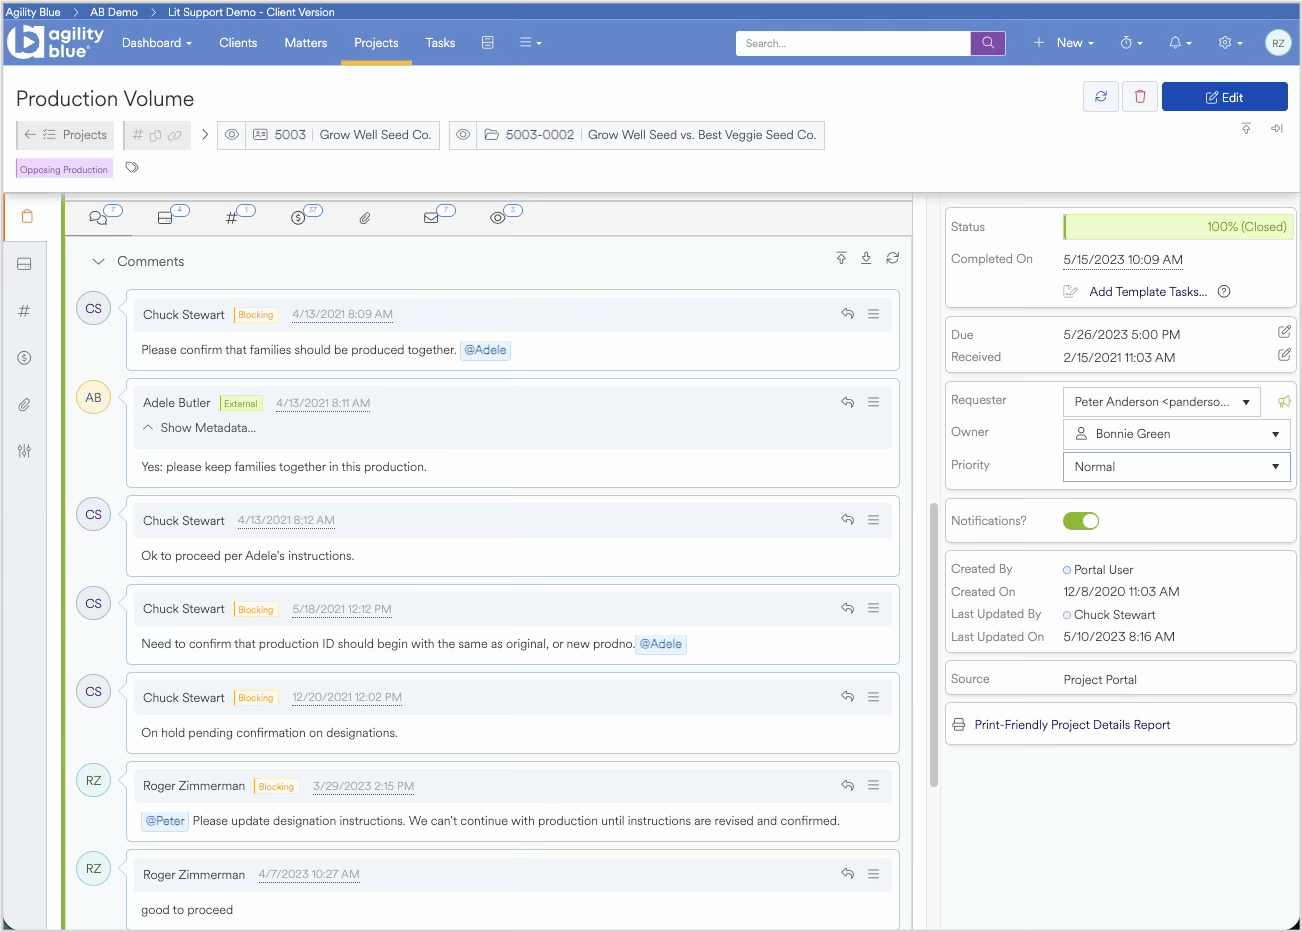
Screenshot of a project management software interface showing a task titled 'Re-produce Production Volume' within a project for Grow Well Seed Co. This page displays comments, metadata, and task status on the right side, with various task updates and communication between team members.
An icon with a white circle containing a graph with an upward trend line, over a brown triangular background, representing growth or progress.

Reporting

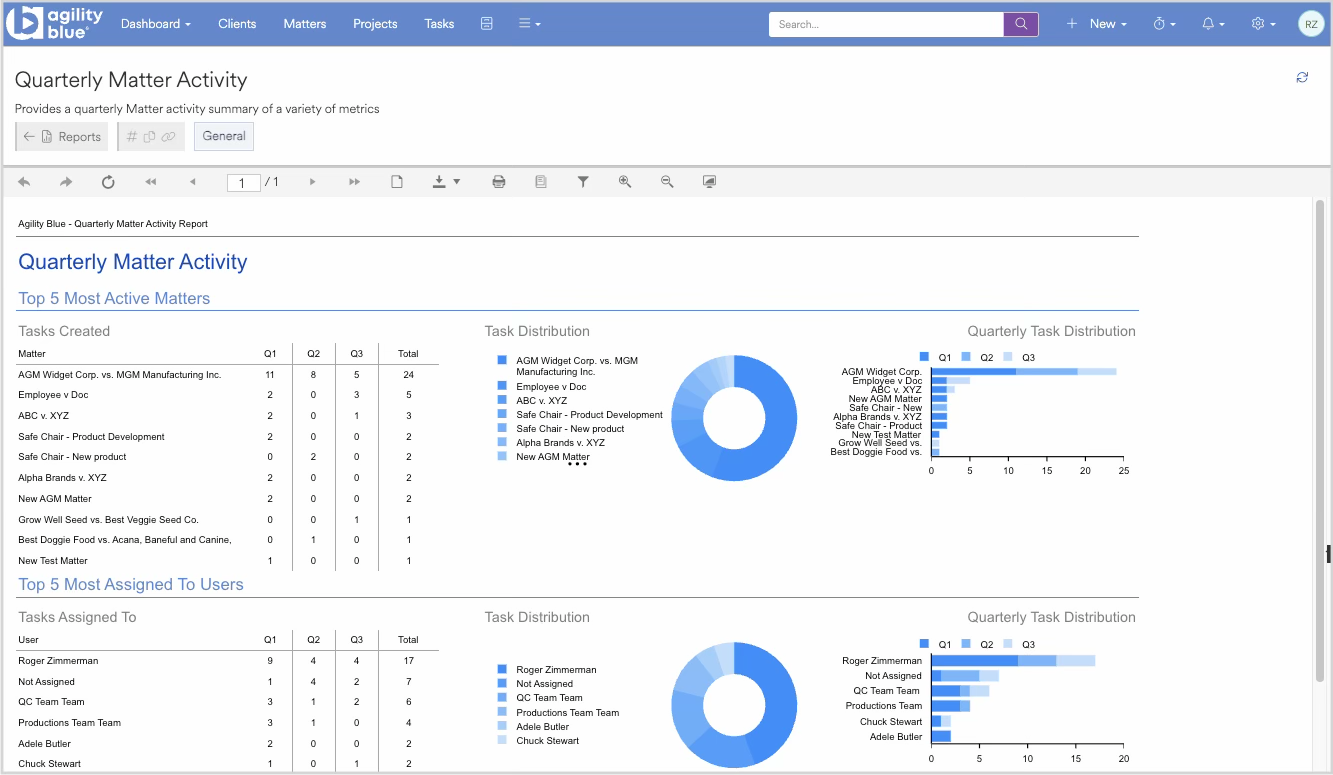
Screenshot of a web-based quarterly matter activity report with bar charts, pie charts, and tables showing task creation, assignment, and distribution metrics.

Get insights on all data tracked in Agility Blue. Generate powerful custom reports, and export to several formats.